import random
import numpy as np
from matplotlib import pyplot as plt
# Set both to true for diamond coach
# yard coach active?
yBoost = True
# daily special coach active?
dBoost = True
# True = maximize DS, False = maximize yards
maxDs = False
# Starting eggballs
eggs = 7810#+600
d = 0
y = 0
costs = [105,101,104,78,76,74,62,64,60,41,48,49]
yds = [7,7,7,6,6,6,5,5,5,4,4,4]
ds = [0.12,0.12,0.12,0.1,0.1,0.1,0.08,0.08,0.08,0.05,0.05,0.05]
dailies = []
yards = []
def bestD(ids):
#return random.choice([x for x in range(len(ids))])
dCost = [costs[ids[x]]/(ds[ids[x]]+0.05*int(dBoost)) for x in range(len(ids))]
b = min(dCost)
return dCost.index(b)
def bestY(ids):
#return random.choice([x for x in range(len(ids))])
yCost = [costs[ids[x]]/(yds[ids[x]]+1*int(yBoost)) for x in range(len(ids))]
b = min(yCost)
return yCost.index(b)
for i in range(100000):
if i % 10000 == 0:
print(i)
e = eggs
d = 0
y = 0
while True:
# Pick 3 players
ps = random.sample([0,3,6,9],3)
num = [random.choice([0,1,2]),random.choice([0,1,2]),random.choice([0,1,2])]
ids = [ps[x]+num[x] for x in range(3)]
# Check if you can afford any of the players, remove the ones you can't or exit if you can't afford any
if e < 105:
for x in range(3):
if e < costs[ids[2-x]]:
del ids[2-x]
if(len(ids) == 0):
break
# Get best choice
if maxDs:
b = bestD(ids)
else:
b = bestY(ids)
b = ids[b]
# Update results based on choice
e -= costs[b]
d += 1 if random.random() < ds[b]+0.05*int(dBoost) else 0
y += yds[b] + 1*int(yBoost)
dailies.append(d)
yards.append(y)
# Show plots of results
showplot = True
if showplot:
label = "Daily Specials"
rmin = min(dailies)
rmax = max(dailies)
freq, bins, patches = plt.hist(dailies,edgecolor='white', label=label, bins=range(rmin,rmax,1))
print("Average DS:",np.average(dailies))
bin_centers = np.diff(bins)*0.5 + bins[:-1]
n = 0
for fr, x, patch in zip(freq, bin_centers, patches):
height = (freq[n]/len(dailies))
plt.annotate("{}".format(height),
xy = (x, height*len(dailies)), # top left corner of the histogram bar
xytext = (0,0.2), # offsetting label position above its bar
textcoords = "offset points", # Offset (in points) from the *xy* value
ha = 'center', va = 'bottom'
)
n = n+1
plt.legend()
plt.show()
# Yard graph will show after you close daily special graph
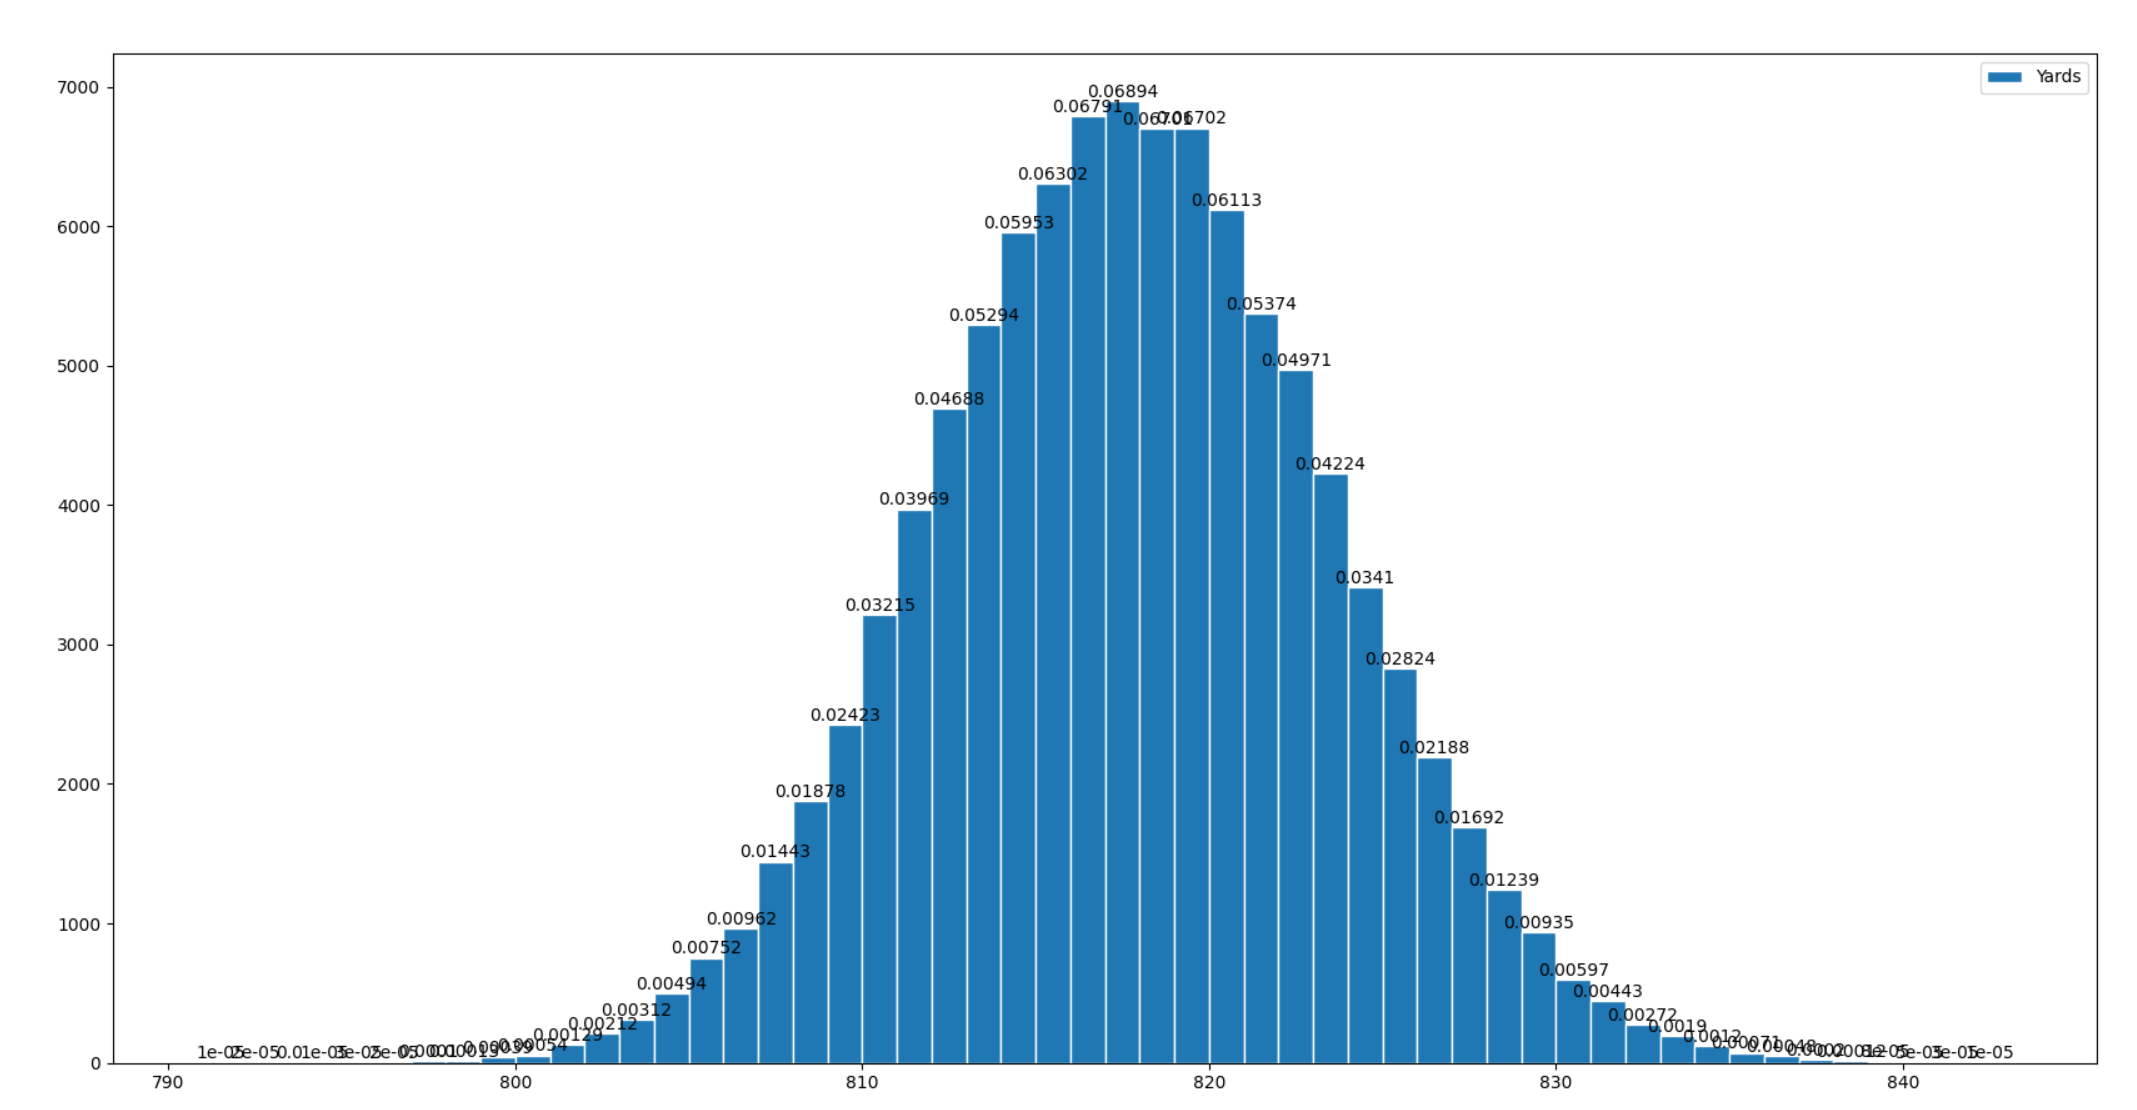
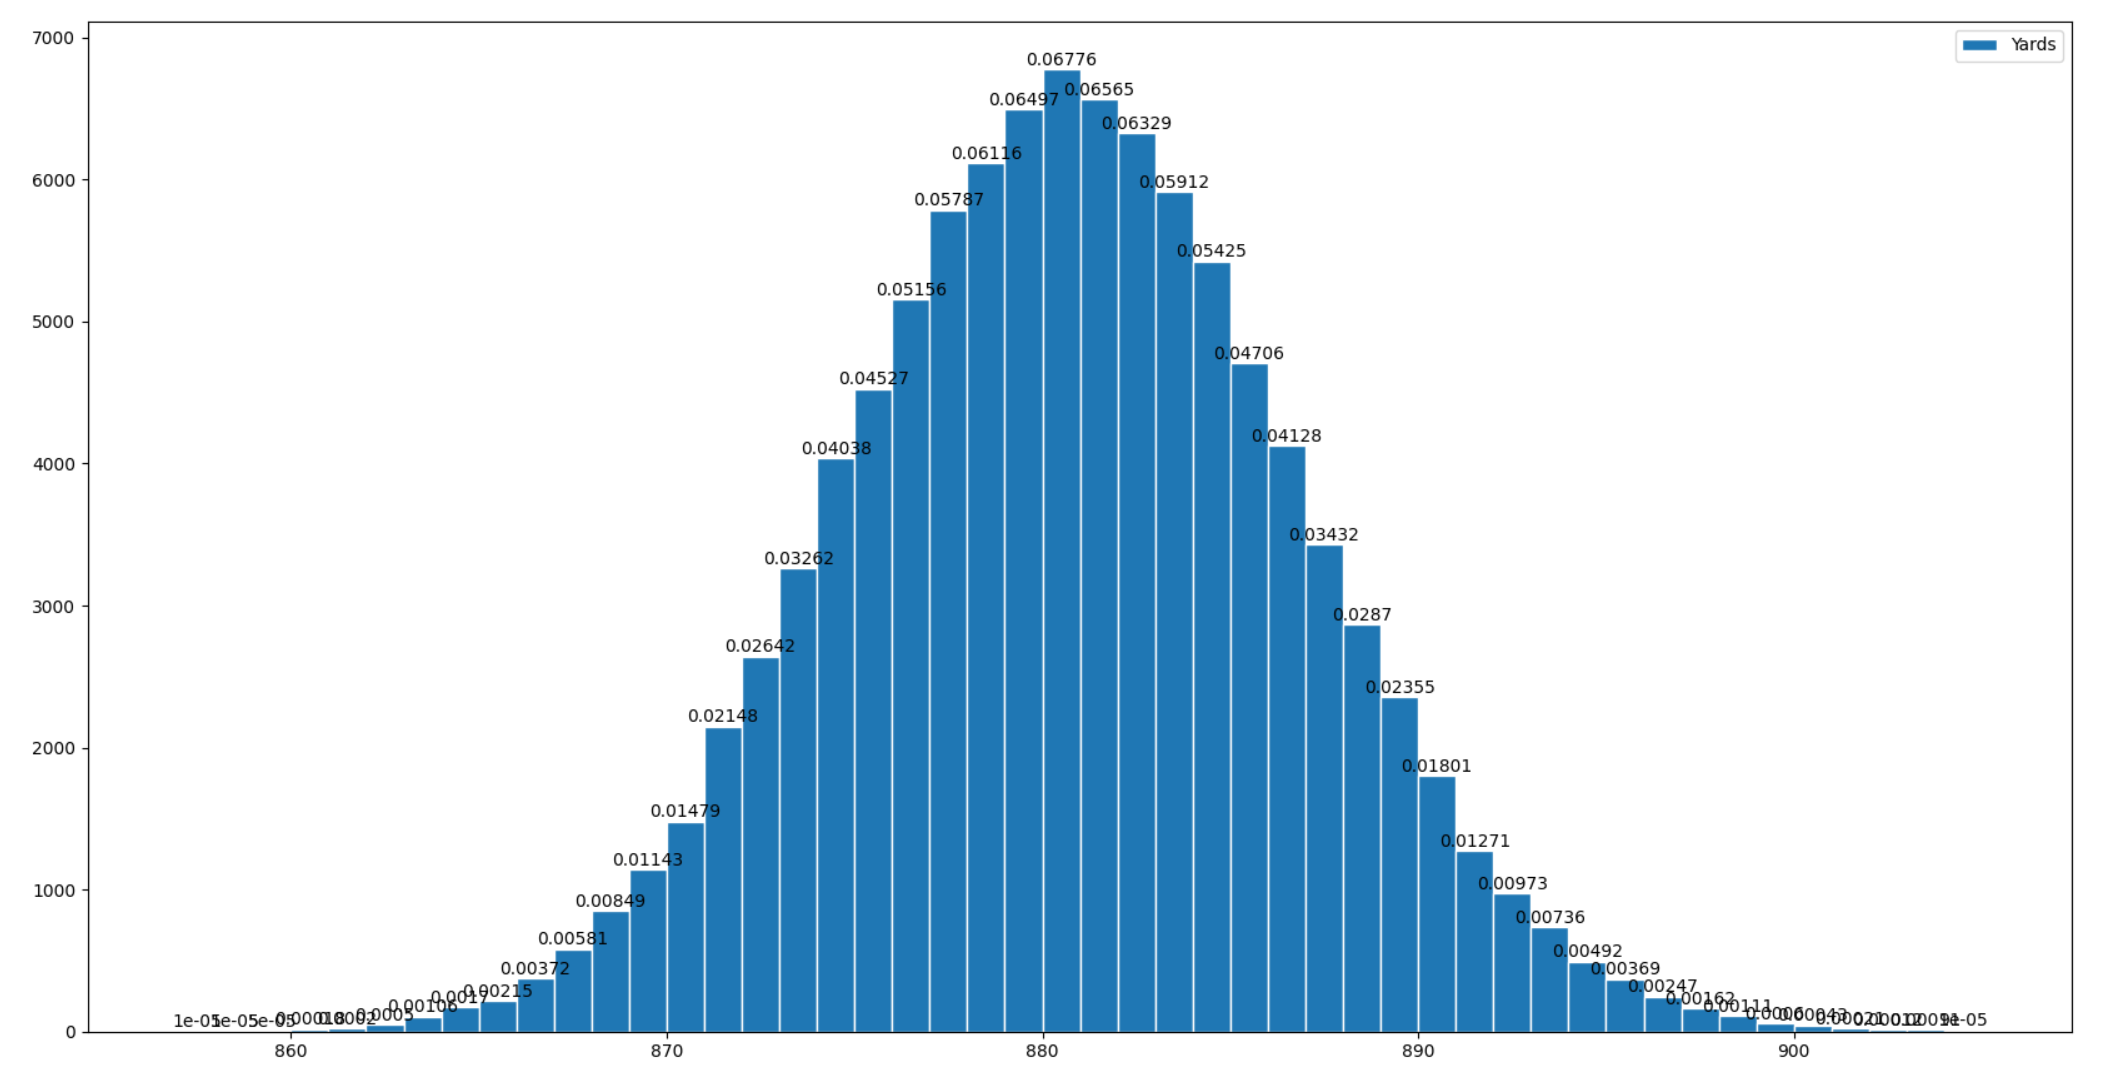
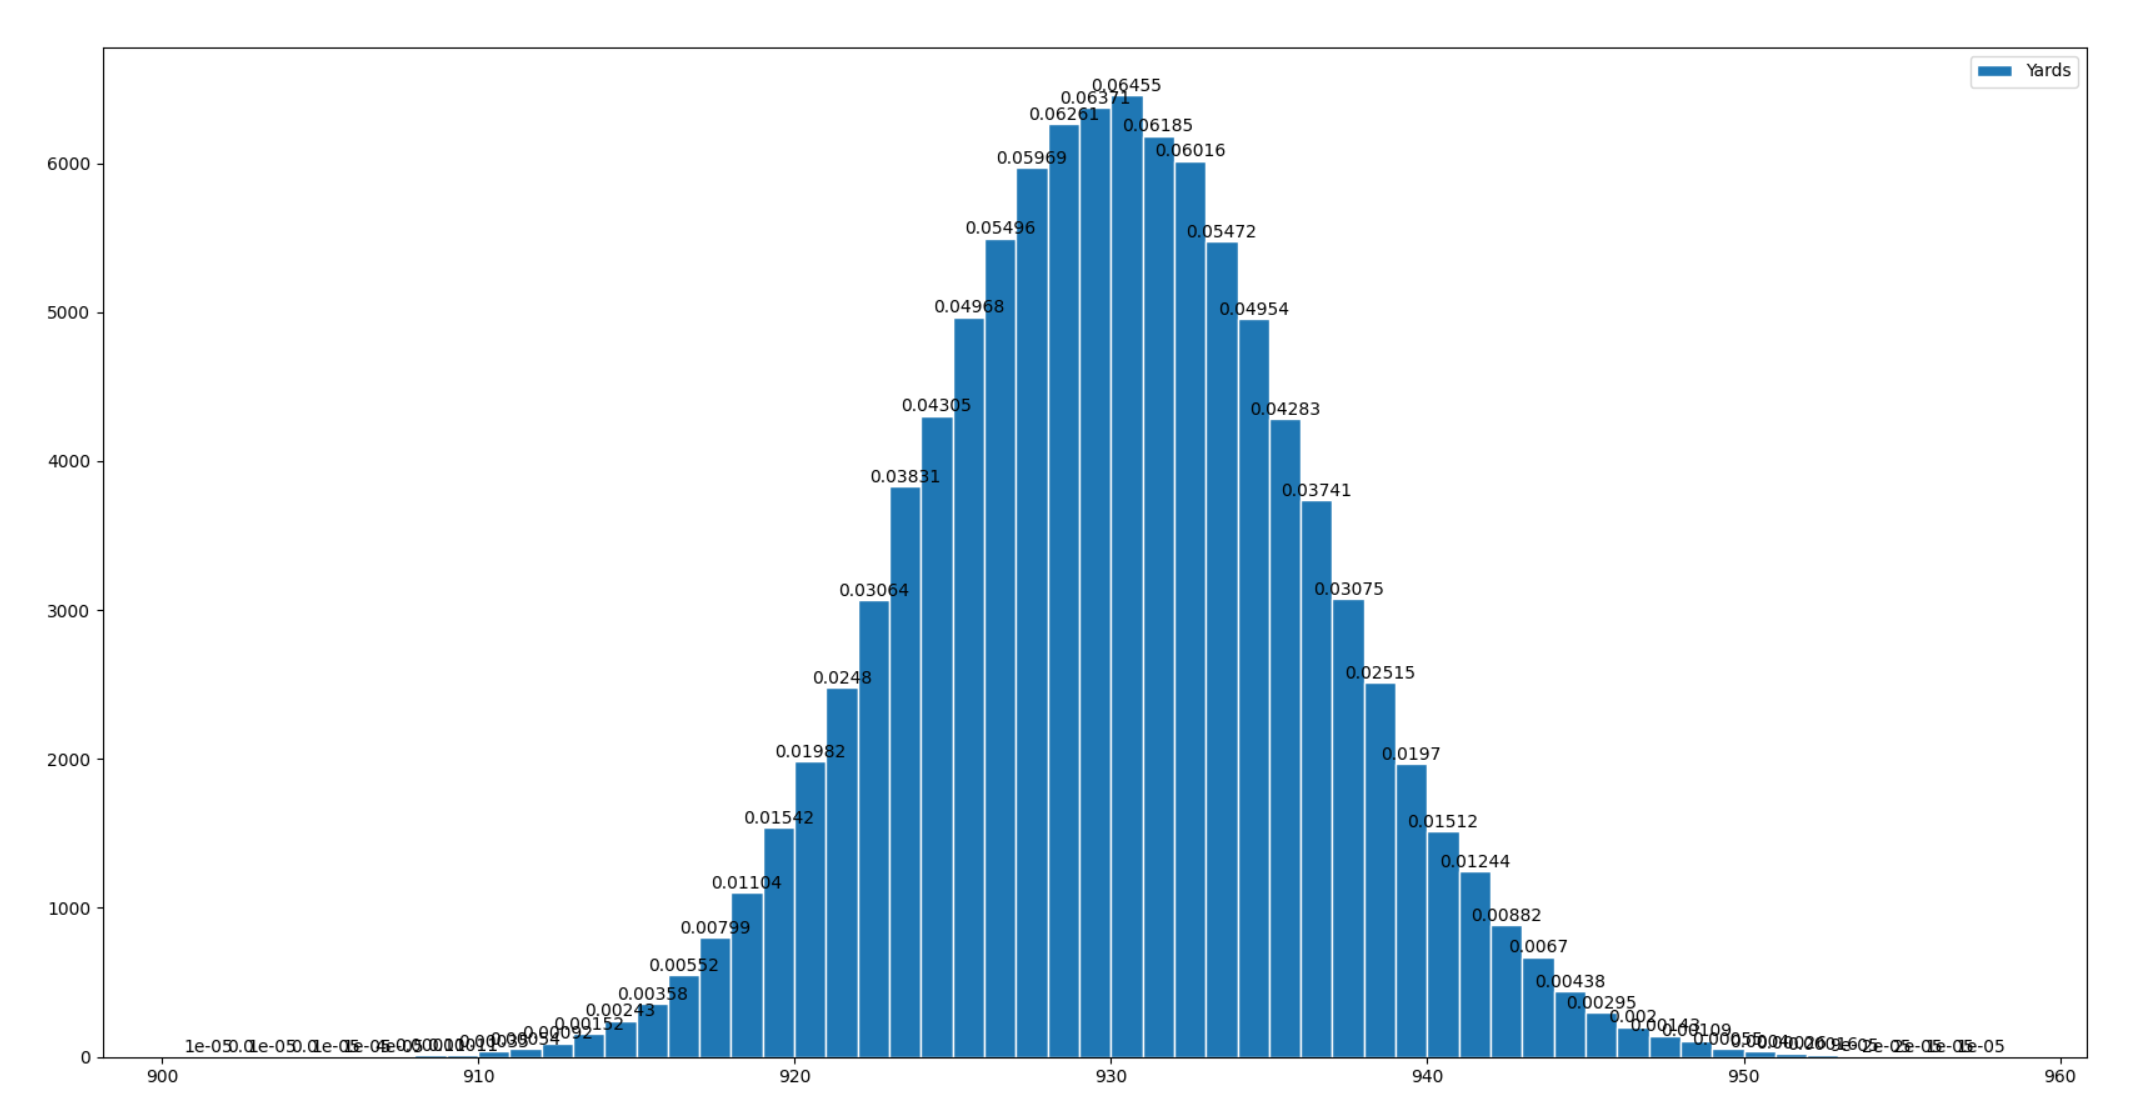
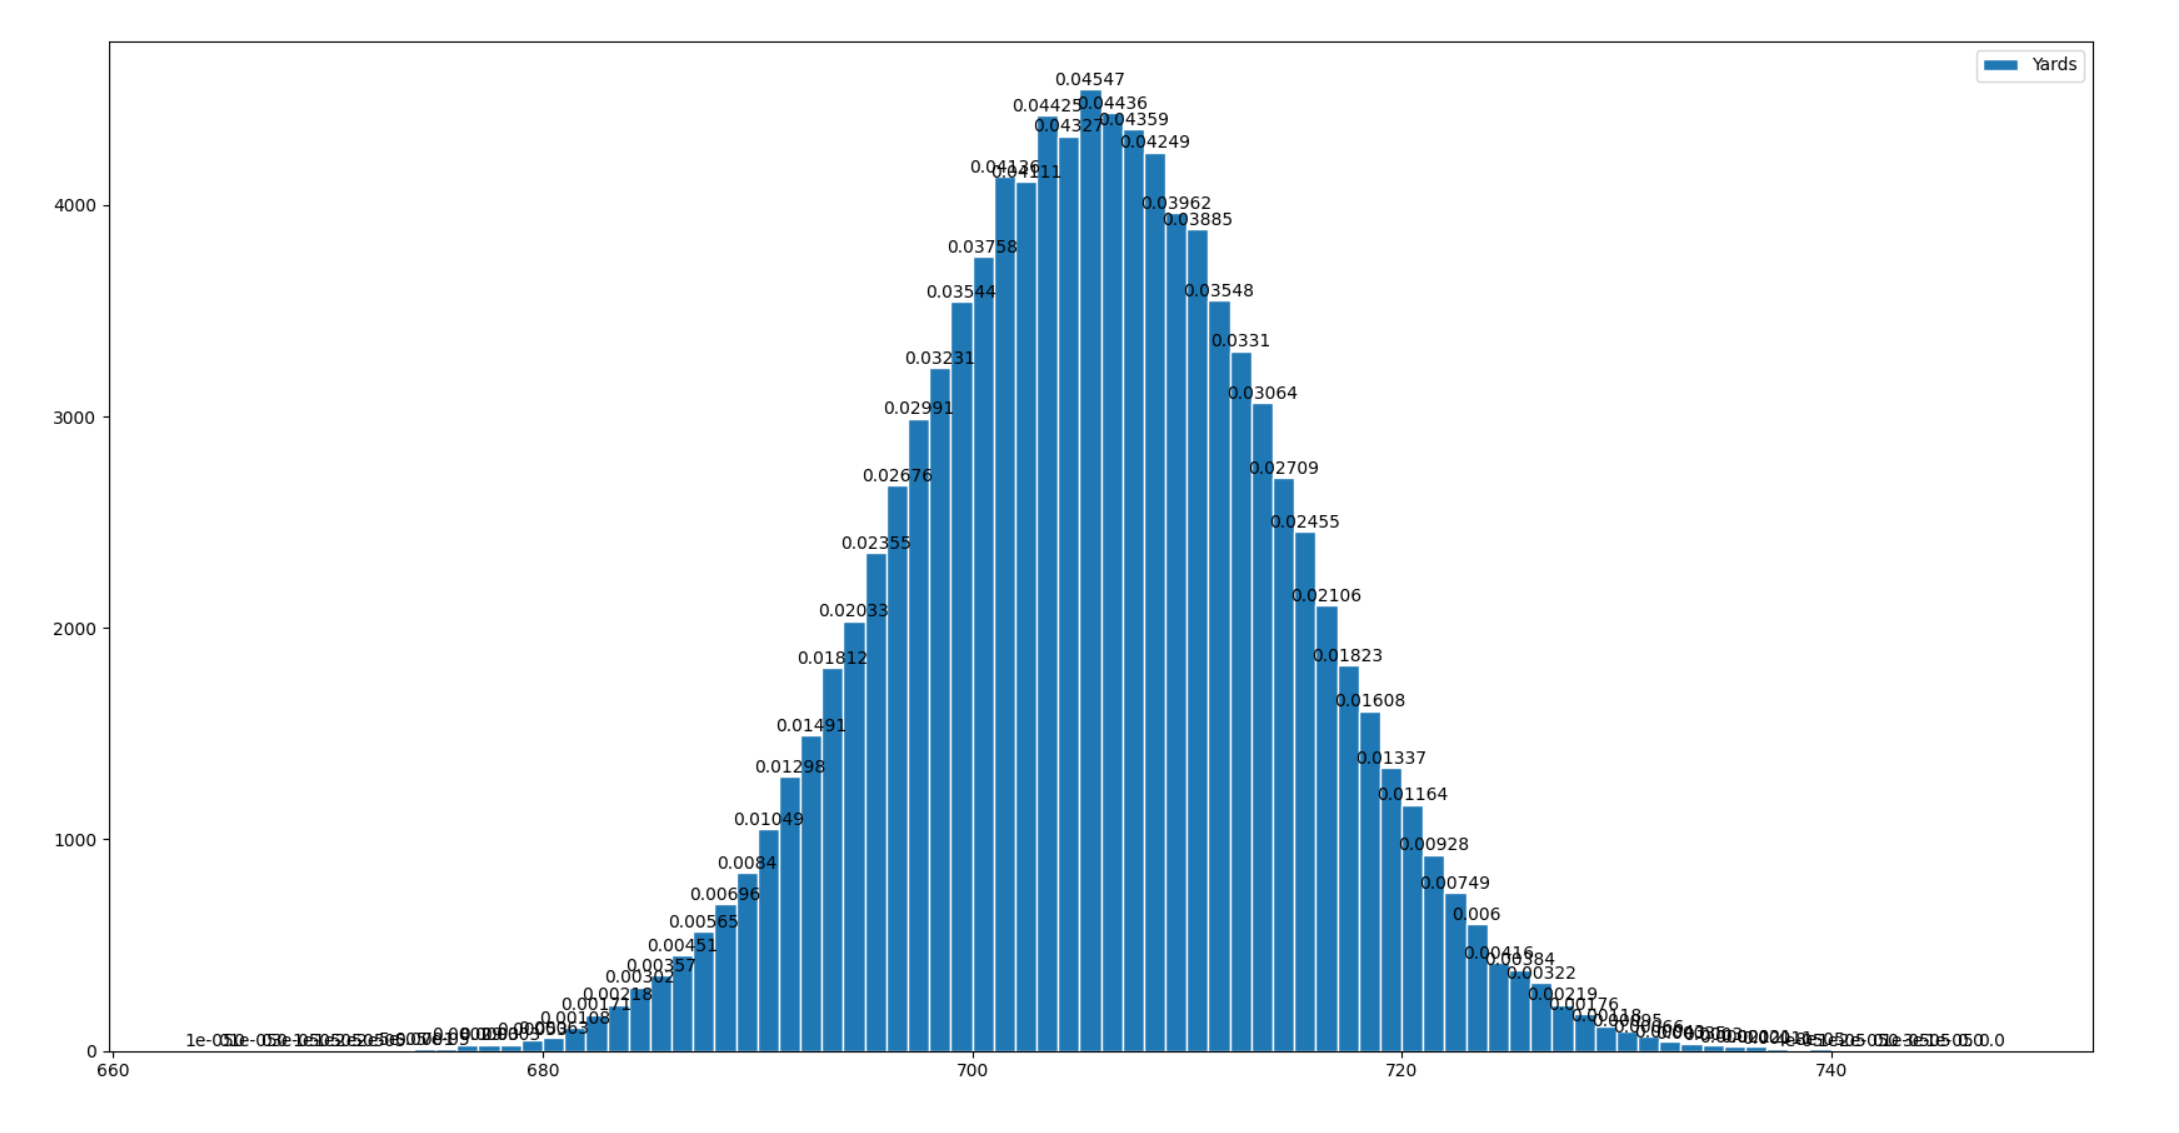
label = "Yards"
rmin = min(yards)
rmax = max(yards)
freq, bins, patches = plt.hist(yards,edgecolor='white', label=label, bins=range(rmin,rmax,1))
print("Average Yards:",np.average(yards))
bin_centers = np.diff(bins)*0.5 + bins[:-1]
n = 0
for fr, x, patch in zip(freq, bin_centers, patches):
height = (freq[n]/len(yards))
plt.annotate("{}".format(height),
xy = (x, height*len(yards)), # top left corner of the histogram bar
xytext = (0,0.2), # offsetting label position above its bar
textcoords = "offset points", # Offset (in points) from the *xy* value
ha = 'center', va = 'bottom'
)
n = n+1
plt.legend()
plt.show()
")